Live-View
The Live-View page (menu Orders → Live-View) is intended for permanent display, e.g. on a control room monitor. It shows the current order and calculation load of the system and the most recently calculated palletizing plan.
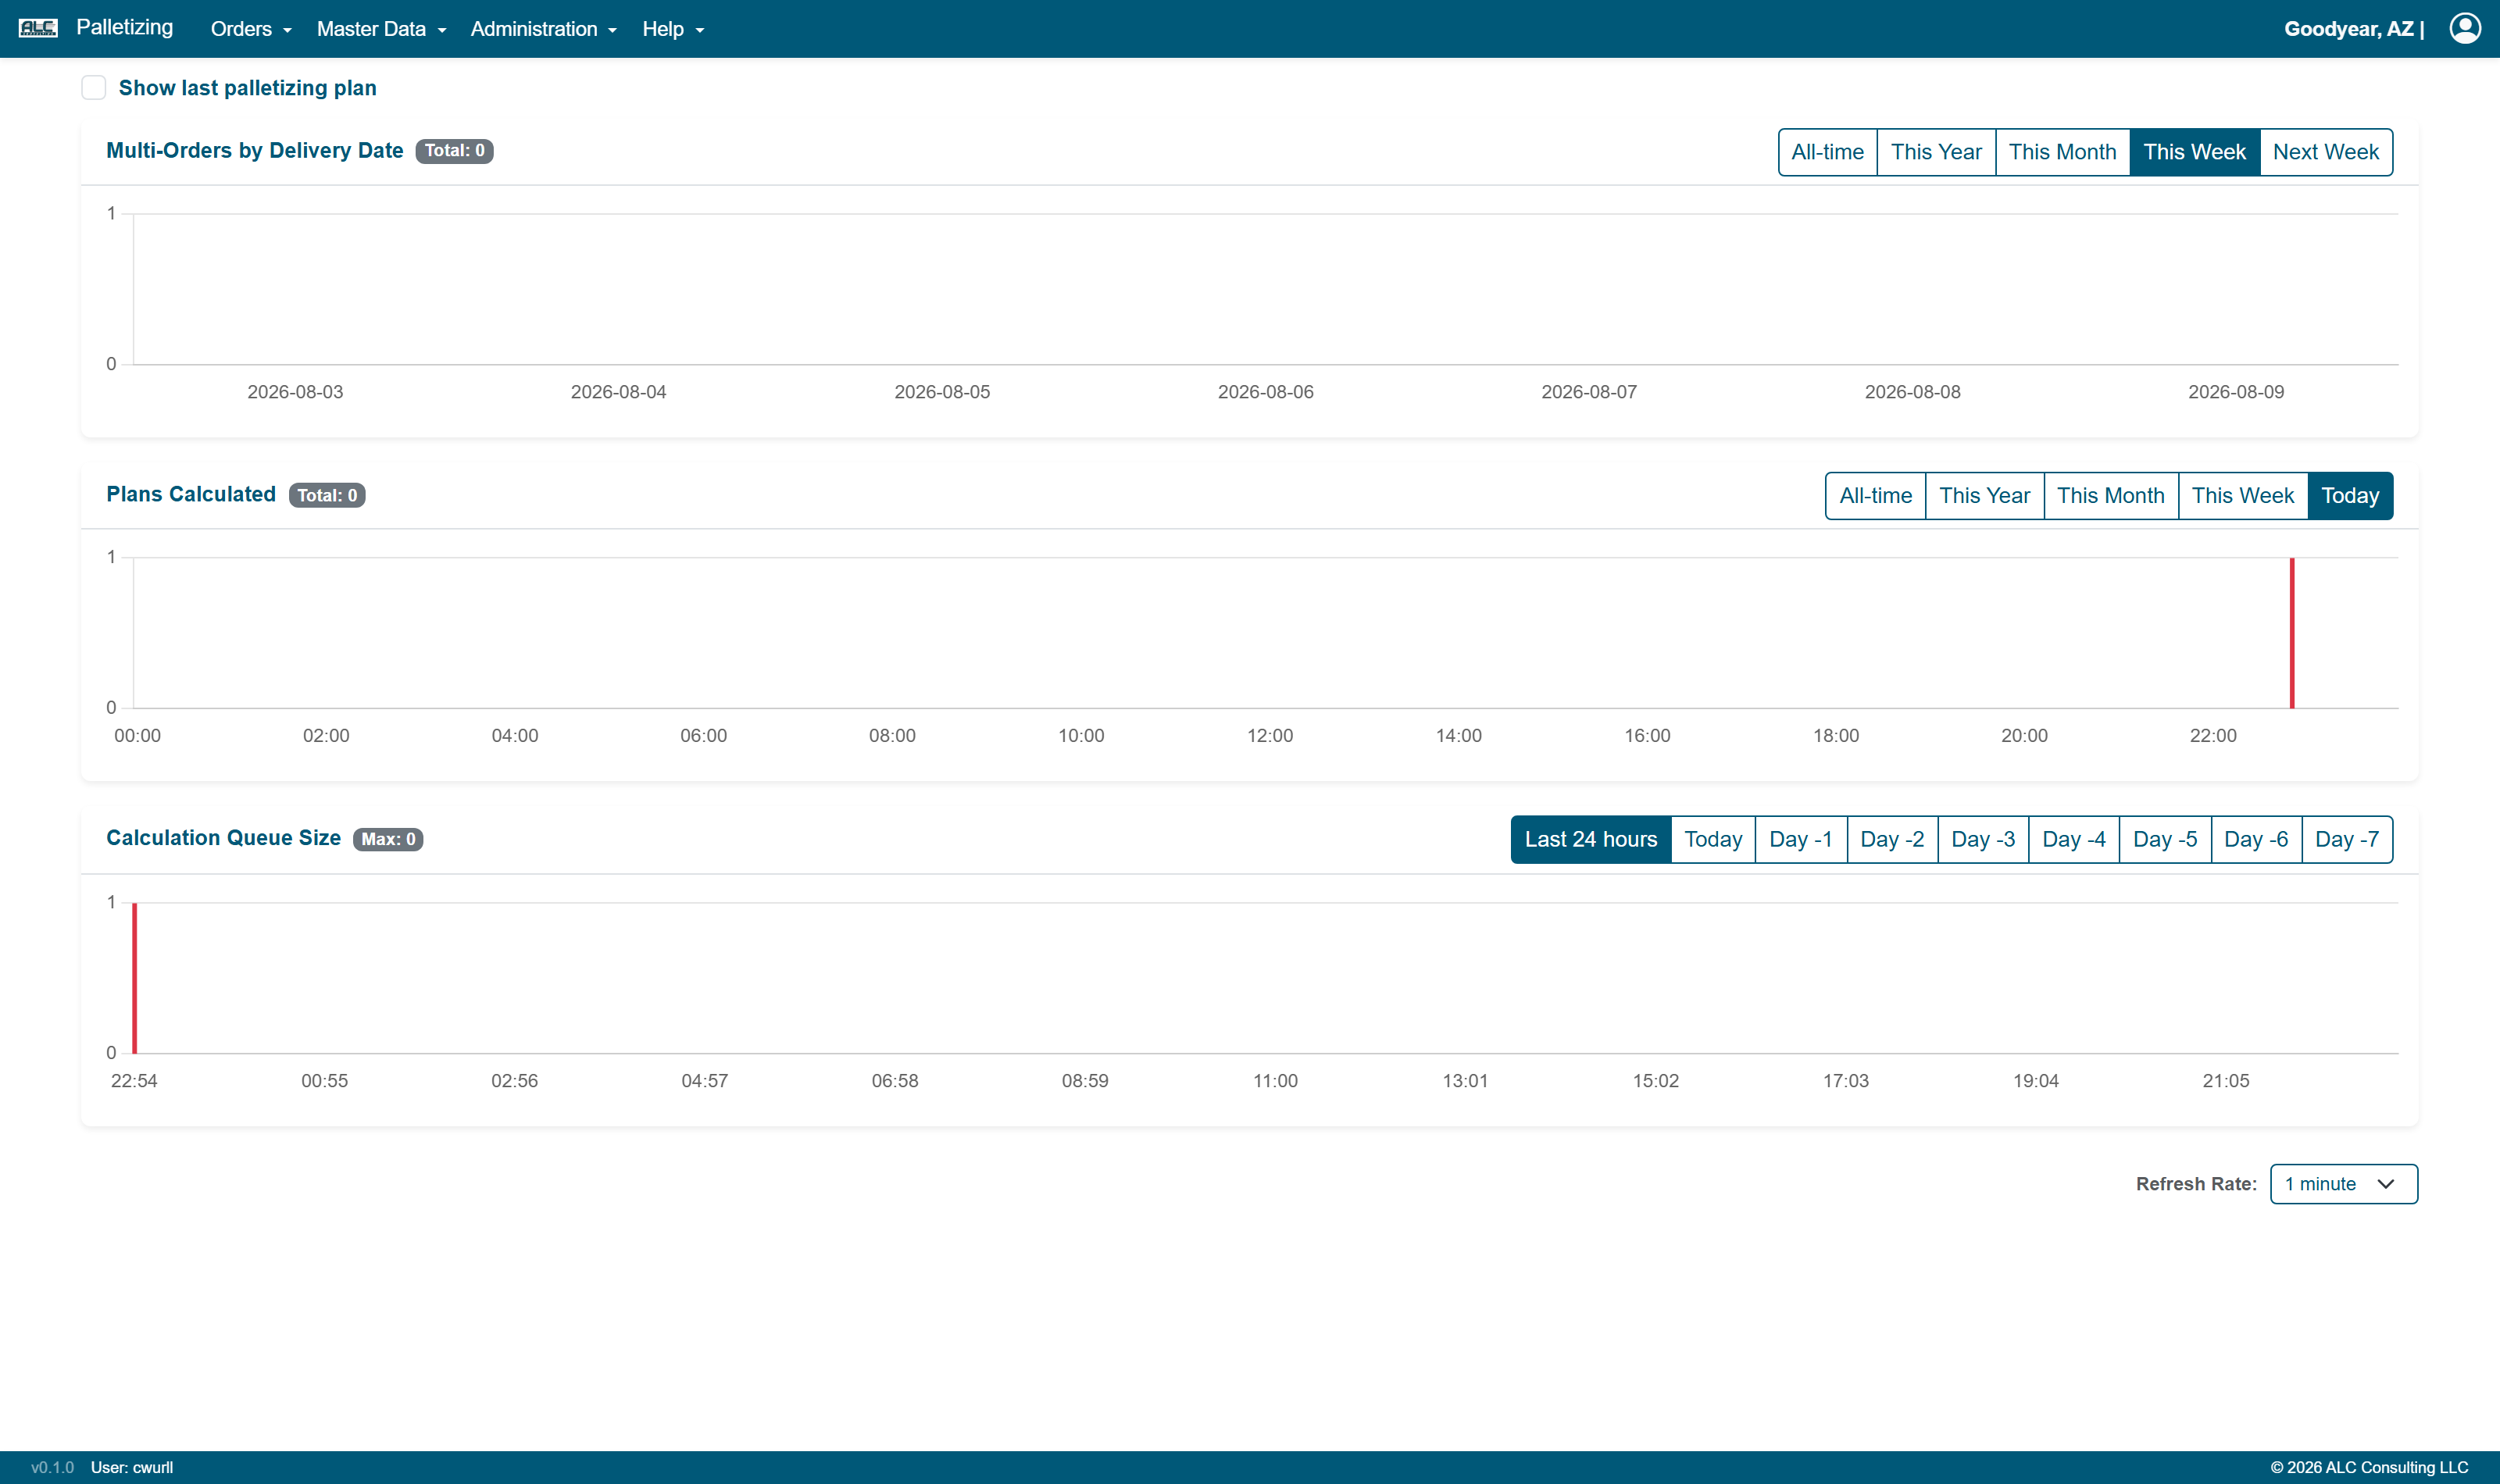
Charts
| Chart | Description |
|---|---|
| Multi-Orders by Delivery Date | Number of multi-orders per delivery date. Timeframe: All-time, This Year, This Month, This Week, Next Week |
| Plans Calculated | Number of calculated palletizing plans over time. Timeframe: All-time, This Year, This Month, This Week, Today |
| Calculation Queue Size | Size of the calculation queue. Timeframe: Last 24 hours, Today, Day -2 … Day -7 |
The total (or, for the queue, the maximum) of the selected timeframe is displayed next to the chart title.
Last Palletizing Plan
Below the charts, the pallets of the most recently calculated palletizing plan are shown as an interactive 3D visualization. The corresponding order ID is part of the panel title. Only a limited number of pallets is rendered at once; use the pagination controls below the visualization to page through the remaining pallets of the plan.
The panel can be hidden with the Show last palletizing plan switch at the top of the page — useful if only the load figures are to be displayed.
Refresh Rate
The Refresh Rate selector at the bottom of the page controls how often the page reloads its data automatically:
| Value | Description |
|---|---|
| 1 minute | The page reloads every minute |
| 5 minutes | The page reloads every five minutes |
| Do not refresh | Automatic reloading is switched off |
A red vertical bar in the charts marks the current point in time.