Dashboard
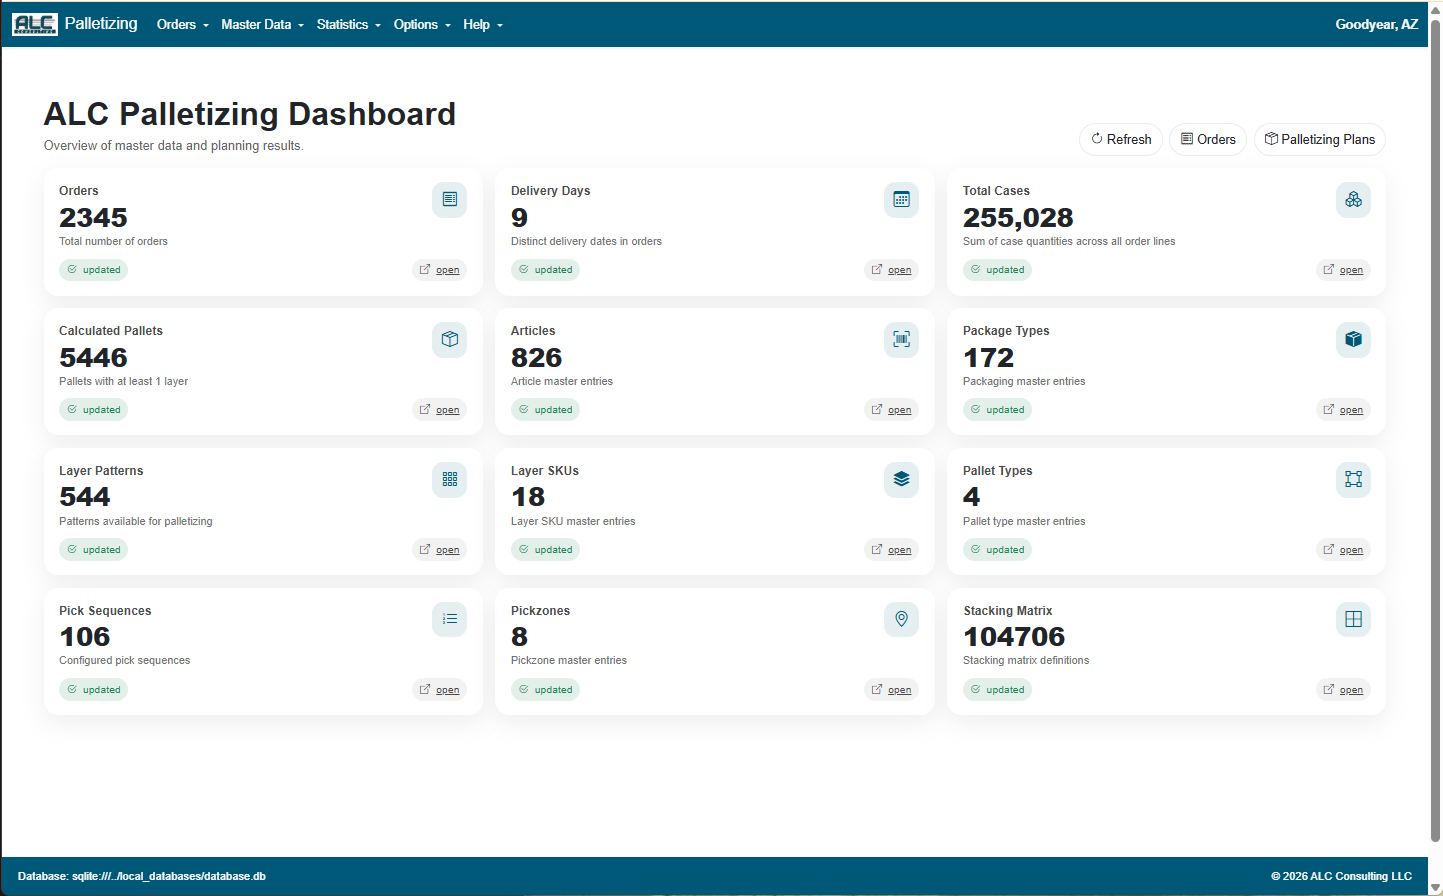
The Dashboard is the start page of the ALC Palletizing Software. It gives an overview of the order volume, the calculated palletizing plans and the current state of the master data.
Time Horizon
All order and plan related figures and charts refer to the selected time horizon. The horizon is chosen with the button group at the top of the page:
| Button | Description |
|---|---|
| All-Time | All orders, regardless of delivery date |
| This Year | Orders with a delivery date in the current year |
| This Month | Orders with a delivery date in the current month |
| This Week | Orders with a delivery date in the current week (default selection) |
| Yesterday | Orders delivered yesterday |
| Today | Orders delivered today |
| Tomorrow | Orders delivered tomorrow |
| Next Week | Orders with a delivery date in the following week |
| Without Date | Orders that have no delivery date assigned |
| Custom | Shows the From / To date pickers; confirm with Apply |
Key Figures
Below the chart, the selected timeframe is summarised in two rows of tiles.
Order and pallet figures
| Tile | Description |
|---|---|
| Multi-Orders in Timeframe | Number of multi-orders with a delivery date inside the selected horizon |
| Multi-Orders without Plan | Number of multi-orders for which no palletizing plan has been calculated yet |
| Calculated Pallets | Total number of pallets in the calculated palletizing plans |
| Pallets Saved | Number of pallets saved compared to a calculation without pallet optimization |
Quality and performance figures
| Tile | Description |
|---|---|
| Average Pallet Fill Rate | Average utilization of the calculated pallets |
| Adjusted Avg. Fill Rate | Average utilization after adjusting for the maximum loading height of the pallet type |
| Adjusted Avg. Height | Average pallet height in percent of the permitted loading height |
| Avg. Plan Waiting Time | Average time a calculation request waited in the queue before it was processed |
| Avg. Plan Calc. Time | Average duration of a palletizing calculation |
If the timeframe contains multi-orders without a plan, a Calculate button appears on the corresponding tile which starts the calculation for all of them.
Note: The Calculate button is only available to users with the Editor or Administrator role.
Charts
The following charts are displayed. Each chart can be exported via the PNG button (image) and the CSV button (underlying data). Charts marked with a pallet type dropdown can additionally be restricted to a single pallet type.
| Chart | Description |
|---|---|
| Multi-Orders / Units by Delivery Date | Dropdown in the chart header: Multi-Orders by Delivery Date (number of multi-orders per delivery date) or Units by Delivery Date (number of ordered units per delivery date) |
| Units by Pickzone | Distribution of the units across the pick zones, based on the pick zone of the layers actually built on the pallets |
| Units by Pallet Type | Distribution of the ordered units across the pallet types |
| Units by Layer Type | Distribution of the ordered units across the layer types |
| Top 100 Articles by Ordered Units | The 100 most frequently ordered articles |
| Top 100 Package Types by Ordered Units | The 100 most frequently ordered package types |
| Top 100 Layer-Patterns by Ordered Units | The 100 most frequently used layer patterns |
| Pallets Saved: Detailed View | Breakdown of the saved pallets |
| Distribution of Pallets per Order | How many orders result in how many pallets |
| Distribution of Articles per Multi-Order | How many multi-orders contain how many different articles |
| Distribution of Units per Multi-Order | How many multi-orders contain how many units |
| Distribution of Adjusted Pallet Height (%) | Distribution of the pallet height utilization |
| Distribution of number of SKUs per Pallet | Pallets by distinct SKUs (x) and average ordered units per SKU (y); bubble size = pallets. Filterable by pickzone; "Exact values" switches the axes from grouped categories to every occurring value |
Master-Data
At the bottom of the page, the Master-Data section shows one tile per master data table with the number of stored records. The Open button navigates directly to the corresponding page: